03 用Assistants中的Code interpreter做数据分析
你好,我是黄佳。
在启程篇的前两课中,我们学习了如何调用Function,以及Thread(线程)和Run(运行交互对话)的来龙去脉,今天我们稍微轻松一下,讲些没有那么烧脑,相对来说比较简单的内容。我们一起来看看,如何使用Assistants中的Code interpreter做数据分析。
什么是 Code interpreter
Code interpreter这个工具的名字有点误导,一开始,我以为它是一个强大的代码分析器,是类似于Github Copilot、CodeLlama这样的工具,能够分析、补全或者生成代码,帮助开发者提高编程效率和代码质量。我想,如果我把一堆程序代码丢进去,Code interpreter应该能帮我分析分析吧(其实ChatGPT不调用任何工具,就已经可以胜任这种代码分析和生成的任务了)。
但是,其实不是,Code interpreter当然可以生成代码,但它的主要的目标工作是帮助我们根据数据文件做数据分析。这里所说的数据分析,是从头到尾的一站式服务——生成数据分析代码的同时,还能直接运行所生成的代码,并呈现结果。
用官方的话来说,Code interpreter是一款托管在OpenAI服务器的工具,允许用Python代码读取、处理和分析数据文件。它支持多种常见的文件格式,如csv、json、pdf等,可以对数据进行切片、过滤、排序、分组、聚合等多种操作,而且内置了数据可视化功能,可以一键生成折线图、柱状图、饼图等图表。OpenAI对Code interpreter使用按量计费,每个会话收费0.03美元,会话默认持续1小时。
Code interpreter并不仅仅存在于Assistants中,而是已经无缝集成到了ChatGPT这款产品的内部。比如,我有一个下图所示的销售数据文件(课程文件和代码在此处下载),就可以让ChatGPT(GPT-4)为我进行数据分析。
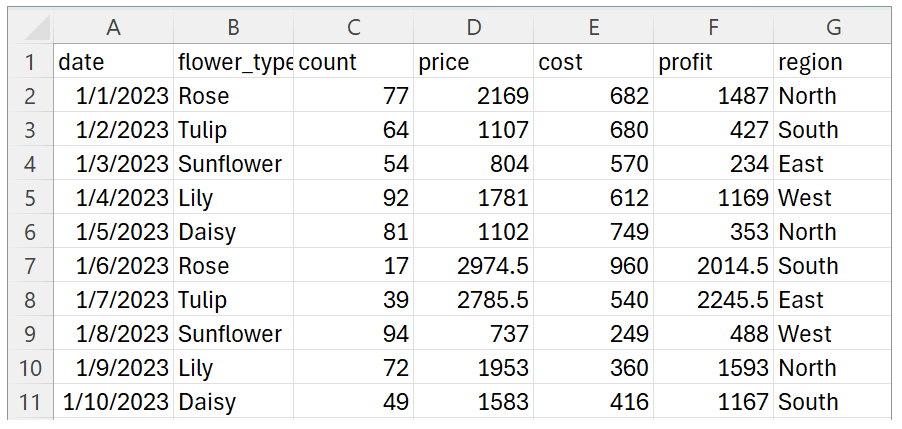
上传给GPT-4之后,ChatGPT的数据分析结果如下。
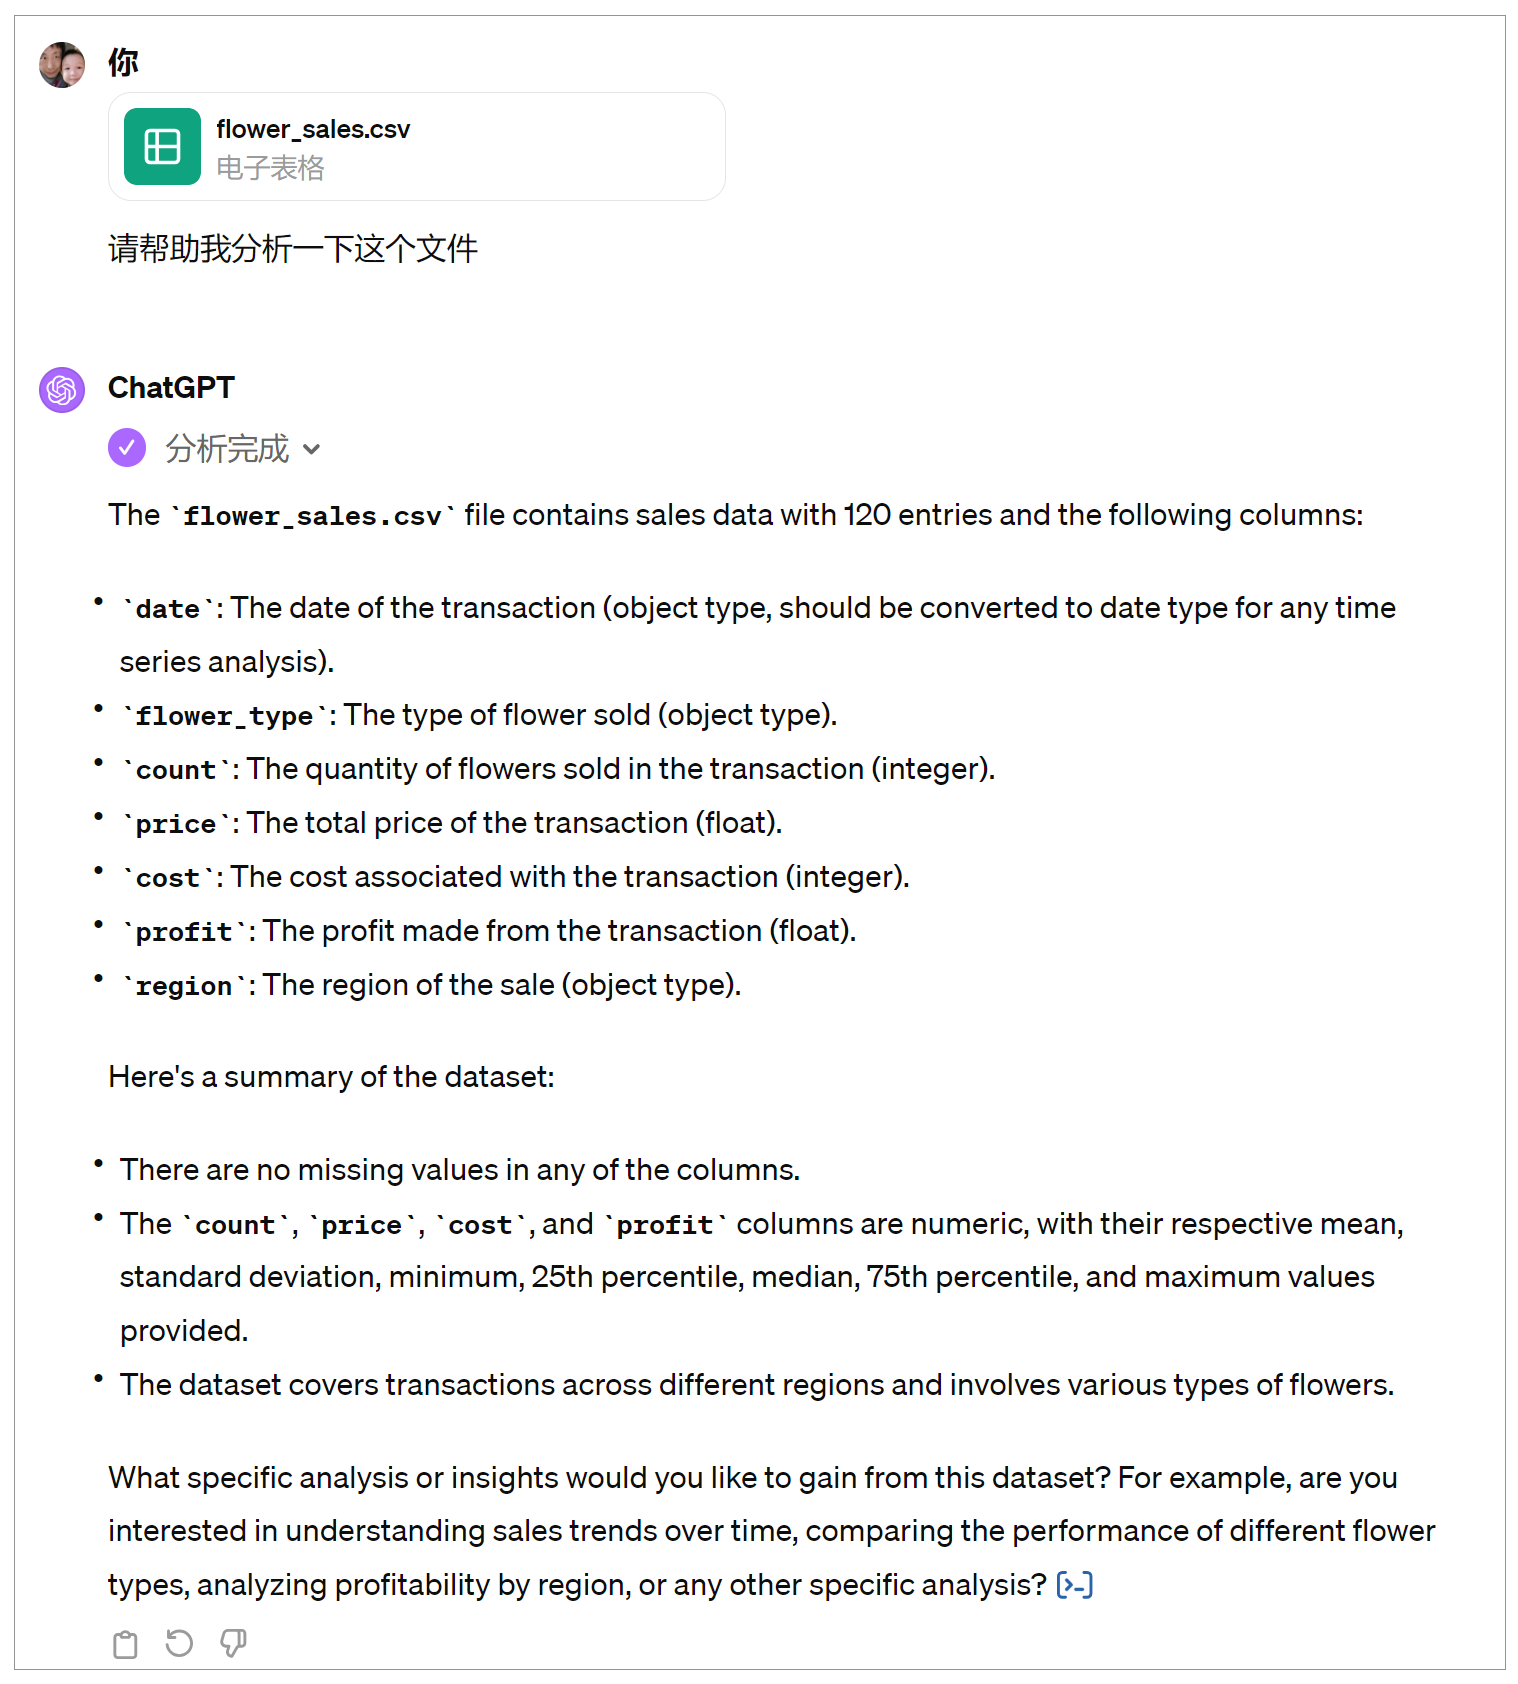
上述分析结果,不仅仅是通过简单的GPT文本读取总结出来的,而是经过了Python代码的加工处理之后所呈现的结果。当我们在ChatGPT对话界面中选择以下这两种箭头,就可以看到Python代码,以及代码生成的数据分析结果。

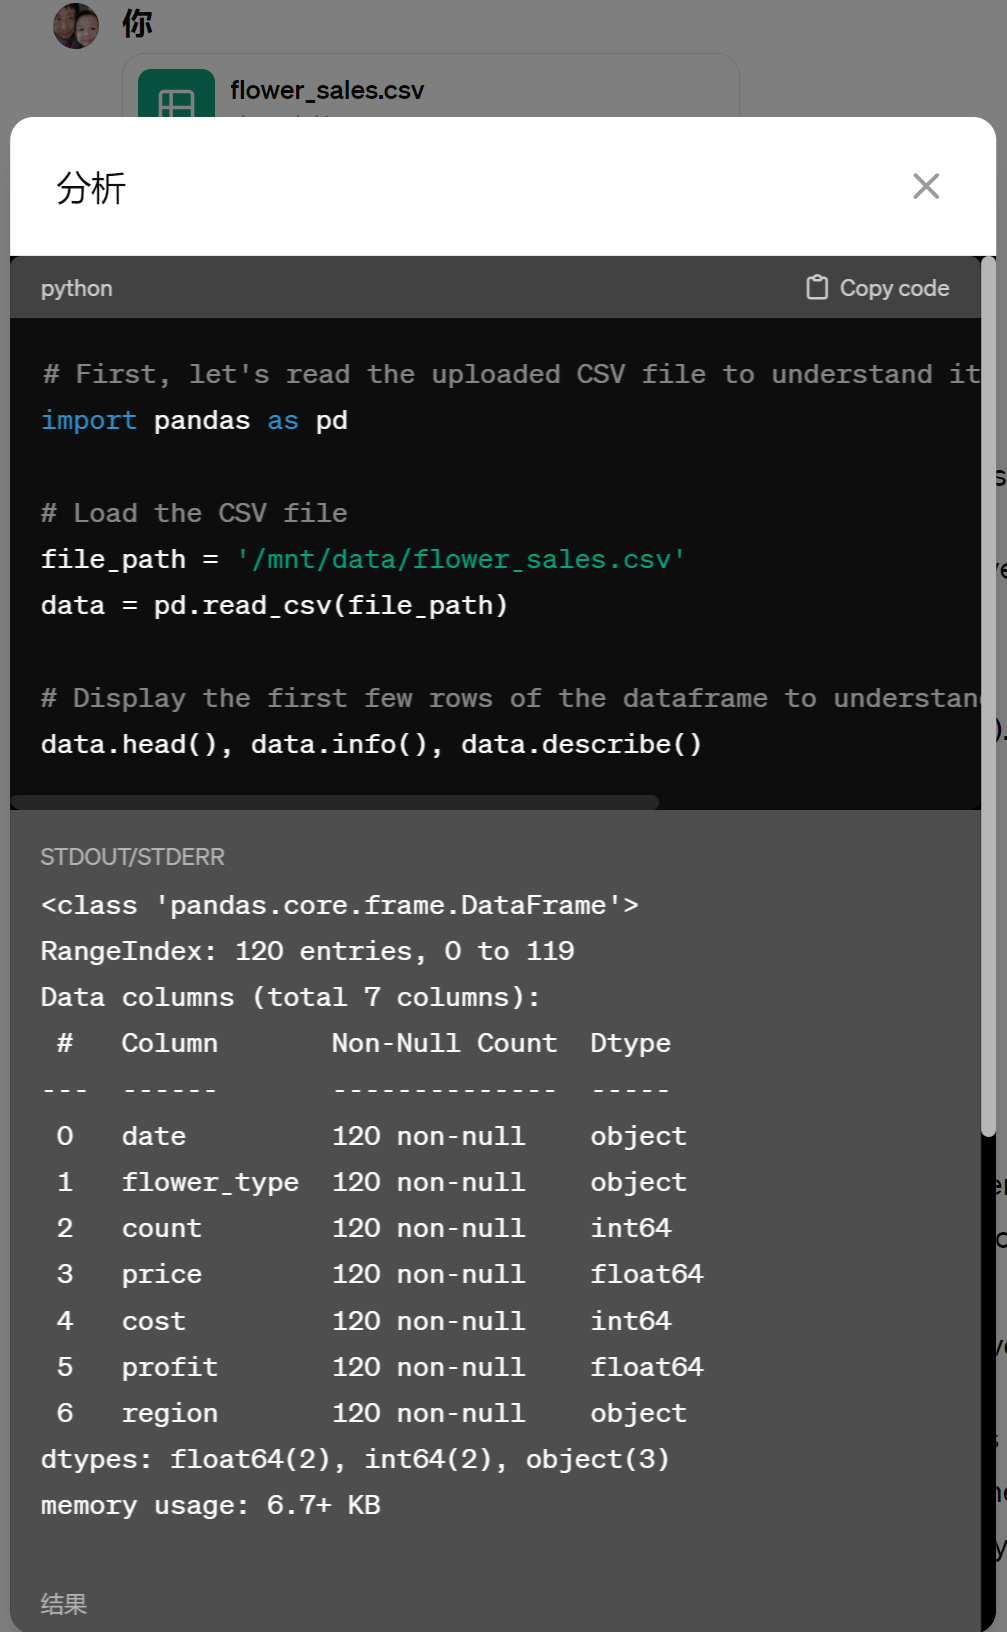
这个过程中,ChatGPT就用到了Code Intepreter的功能。只不过,此时Code Intepreter已经内嵌到ChatGPT中了,ChatGPT知道什么时候应该调用它。
使用 Playground 中的 Code Intepreter
好,下面我们来把这个工具集成到自己的Assistant中,我们还是先通过Playground中的Code Intepreter来看看它的使用机理。
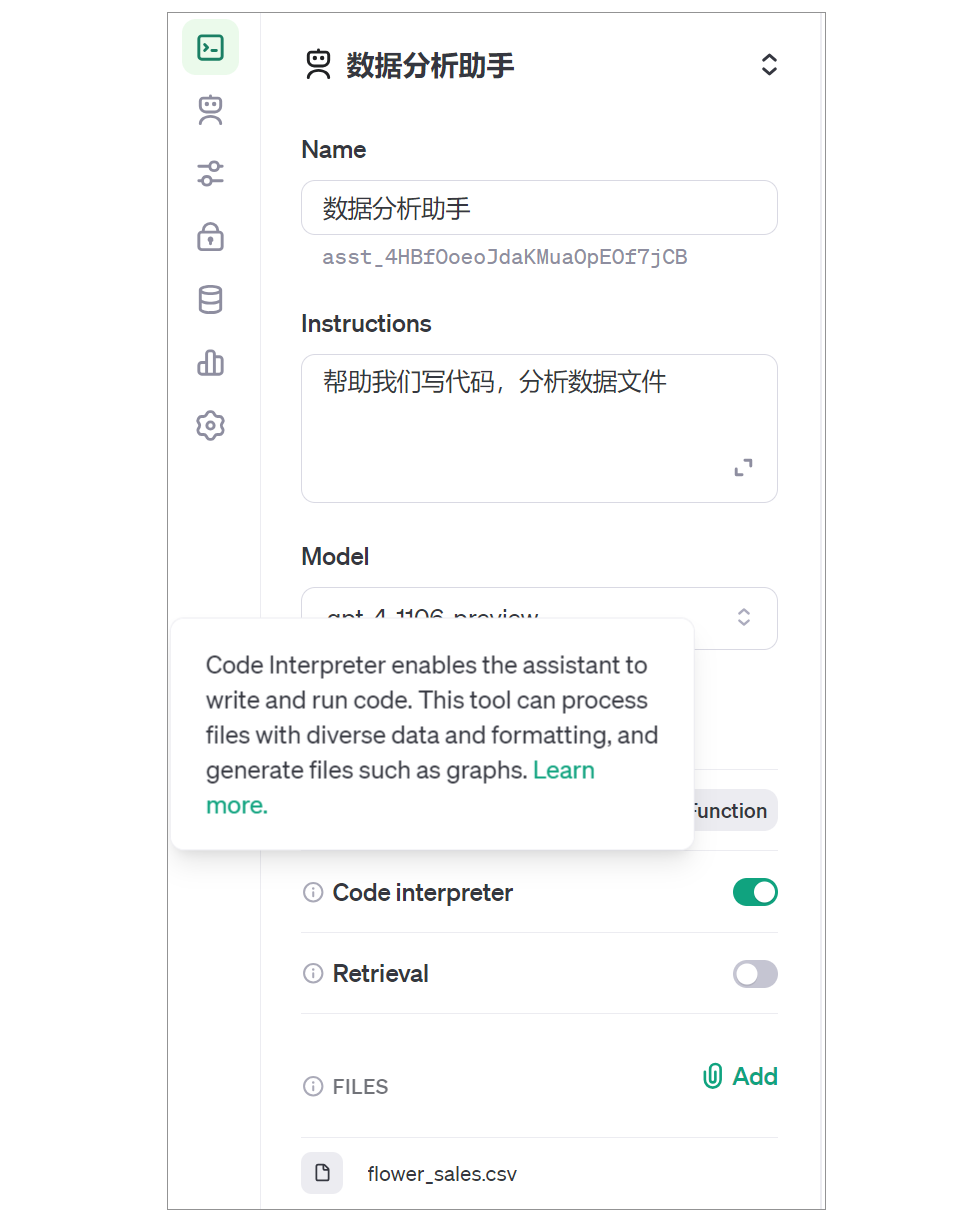
第一步,选择Create assistant新建一个Assistant,并命名为数据分析助手(名字随意)。
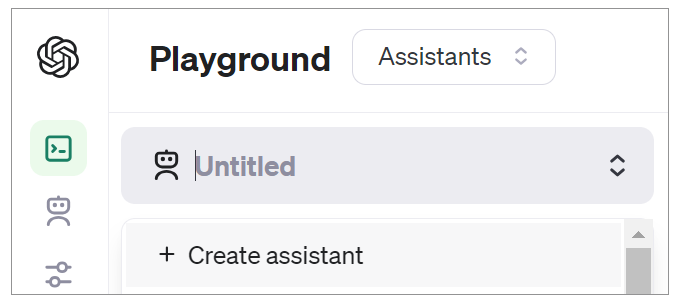
第二步,开启Code interpreter功能,并通过Add功能上传数据文件。
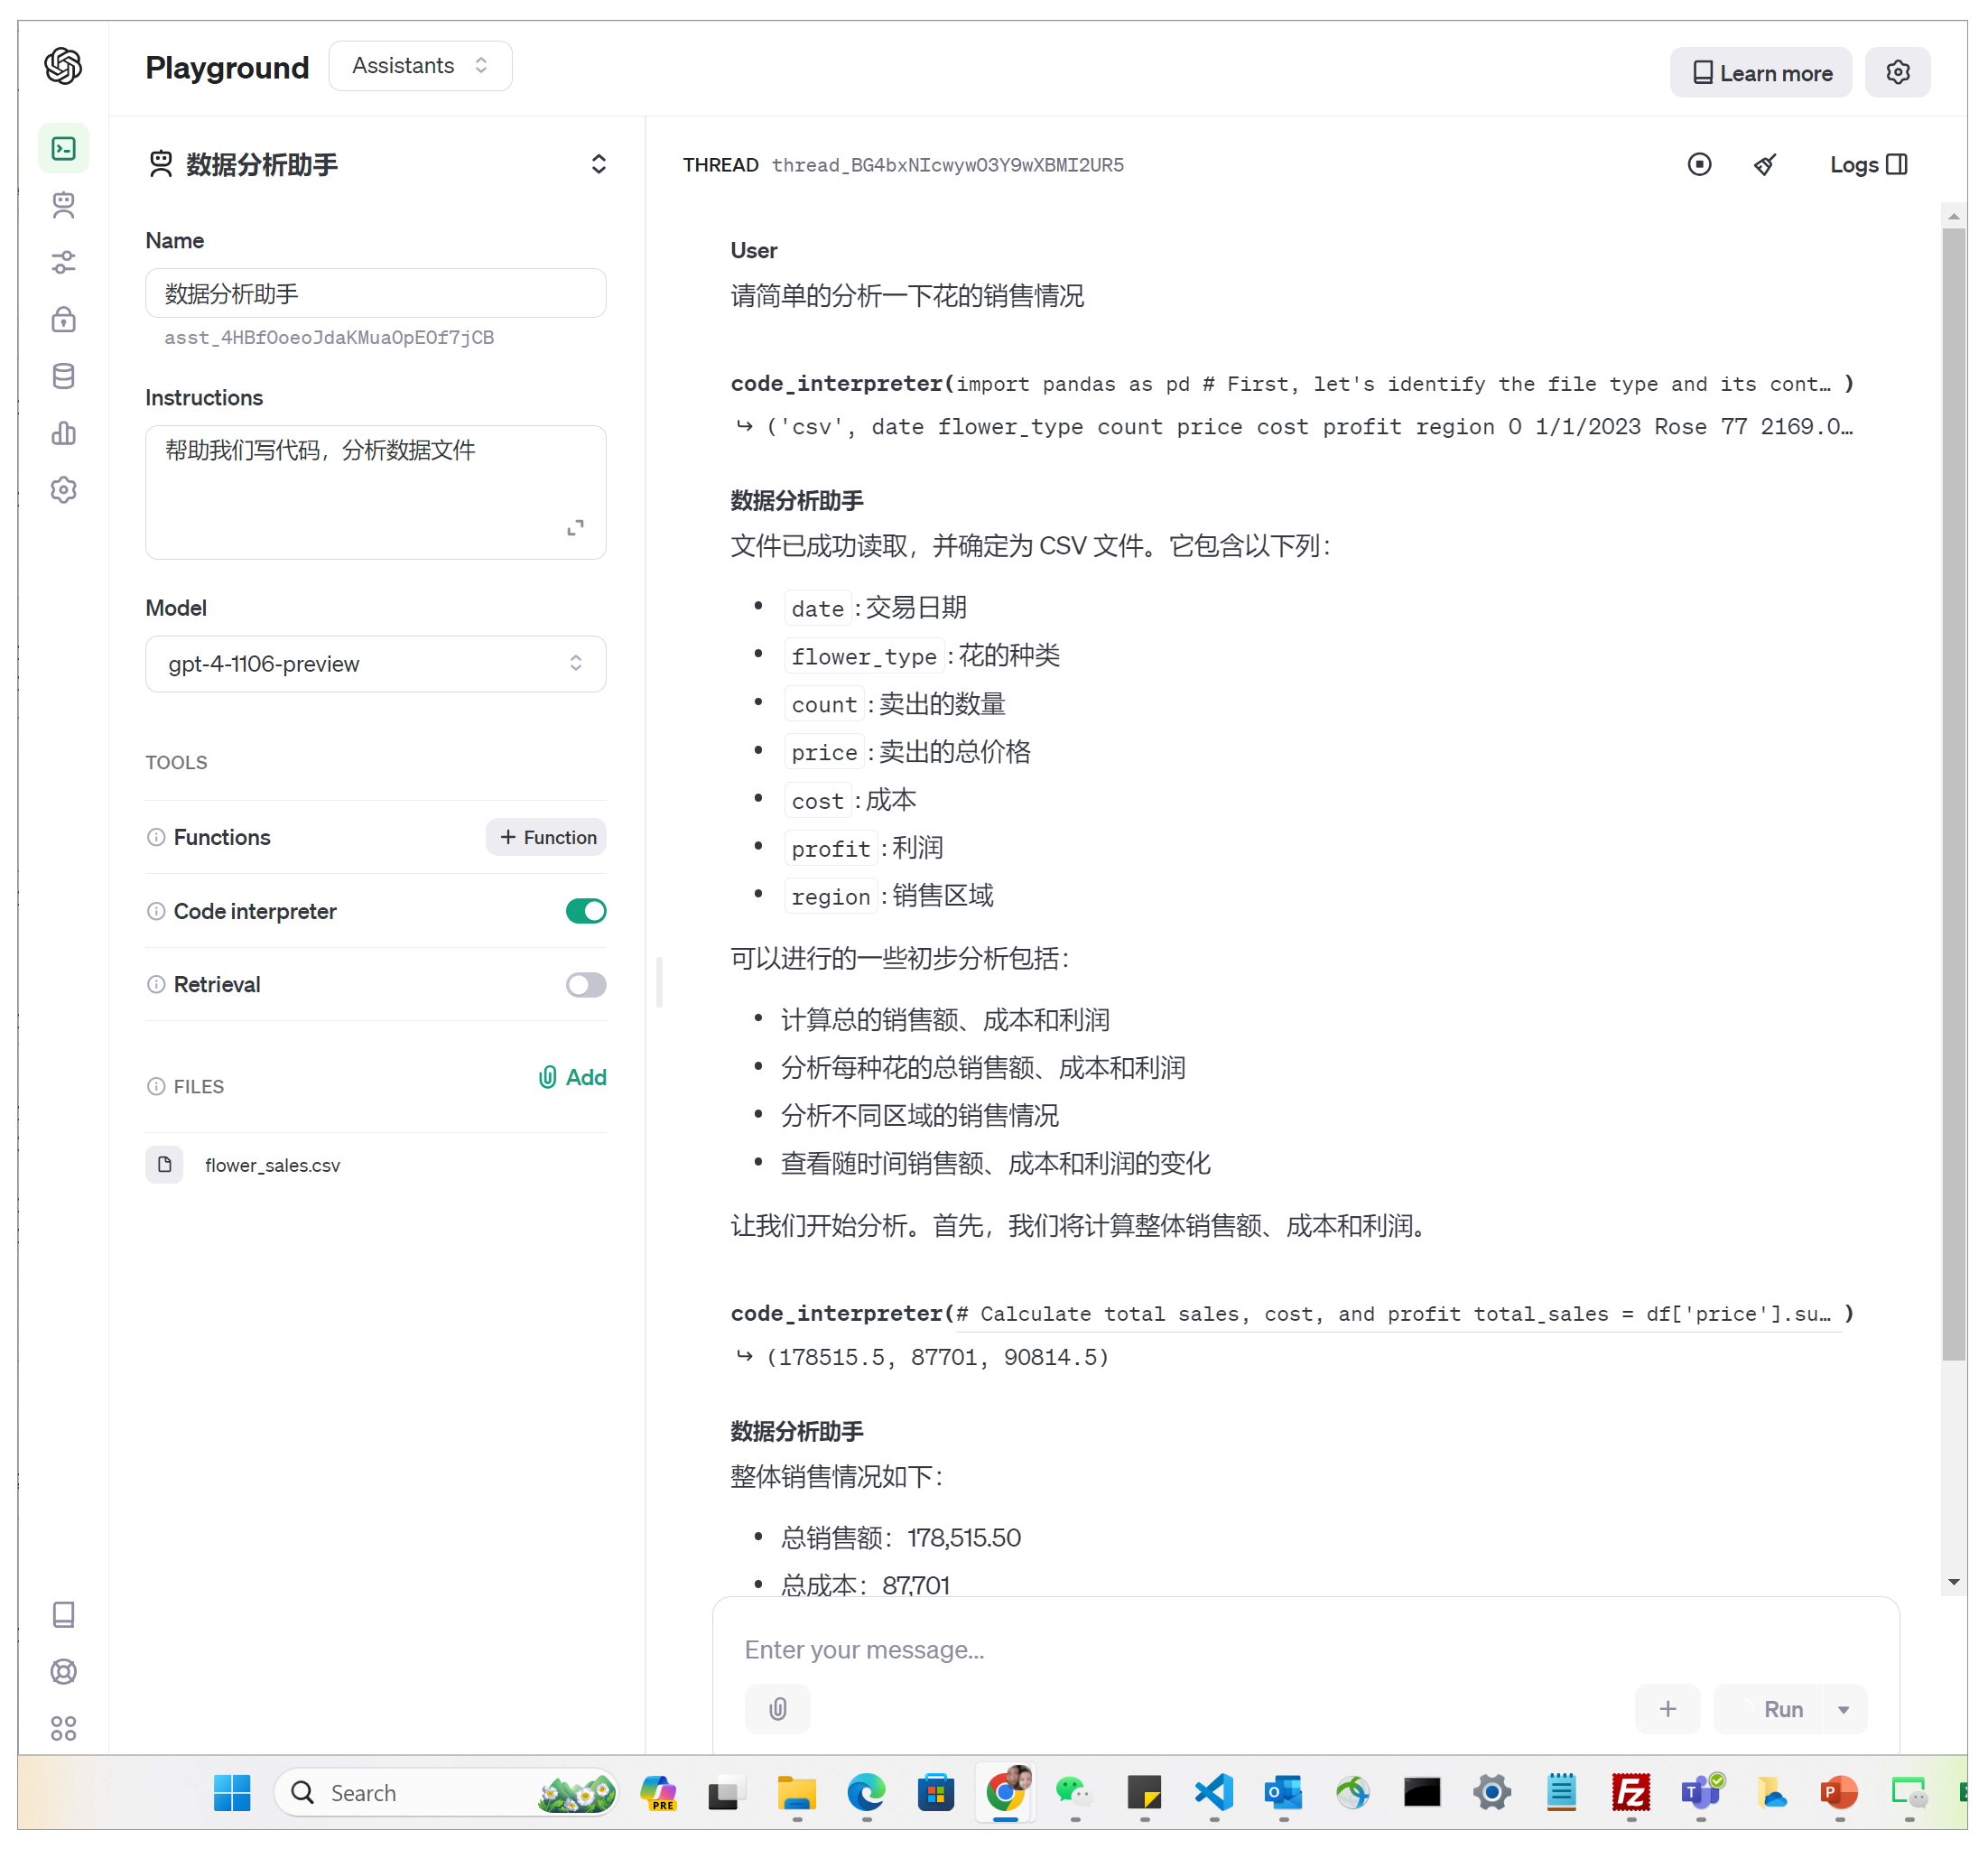
之后,就可以在对话区域内通过自然语言来调用Assistant进行数据分析。
使用 Python 进行数据分析
现在,让我们暂时忘掉Code intepreter,回到Python数据分析的领域。我们来基于数据文件 flower_sales.csv 手工编写一些代码进行基本的数据分析操作。
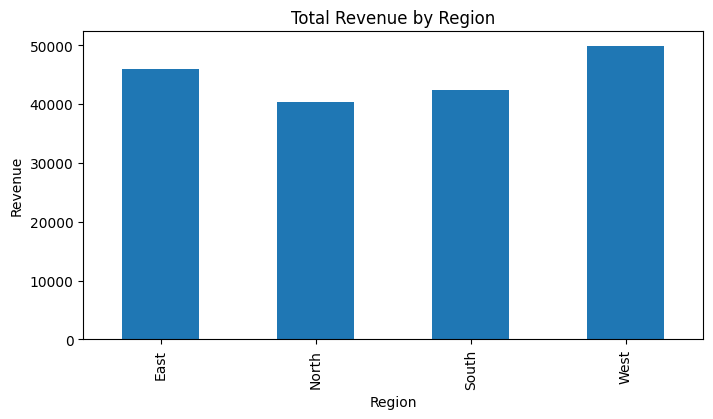
首先,我们按地区计算总收入,并绘制柱状图。
import pandas as pd
import matplotlib.pyplot as plt

# Read the CSV file
df = pd.read_csv('flower_sales.csv')

# Calculate total revenue by region and create a bar chart
revenue_by_region = df.groupby('region')['price'].sum()
revenue_by_region.plot.bar(figsize=(8, 4))
plt.title('Total Revenue by Region')
plt.xlabel('Region')
plt.ylabel('Revenue')
plt.show()
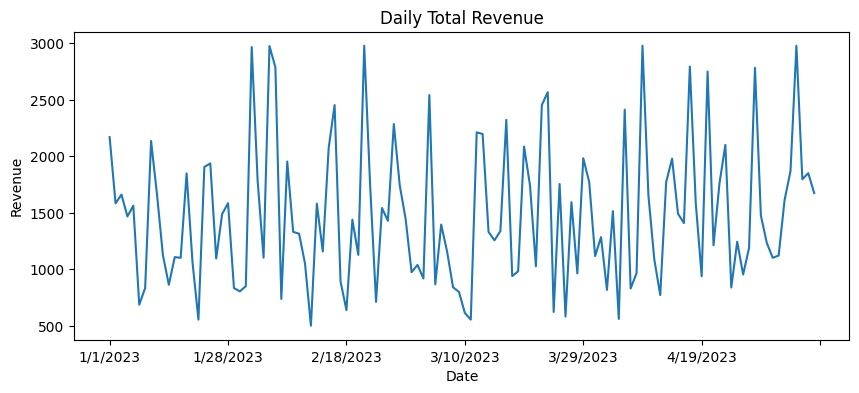
然后,按日期计算每日总收入,并绘制折线图。
# Calculate daily total revenue and create a line chart
daily_revenue = df.groupby('date')['price'].sum()
daily_revenue.plot.line(figsize=(10, 4))
plt.title('Daily Total Revenue')
plt.xlabel('Date')
plt.ylabel('Revenue')
plt.show()
之后,计算各花卉类型的销售占比,并绘制饼图。
# Calculate the sales proportion of each flower type and create a pie chart
flower_sales = df.groupby('flower')['count'].sum()
plt.pie(flower_sales, labels=flower_sales.index, autopct='%1.1f%%')
plt.title('Sales Proportion by Flower Type')
plt.show()
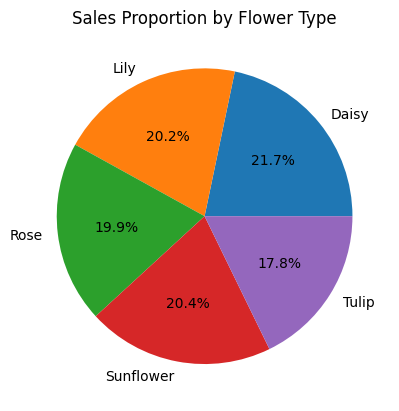
接下来,找出利润最高的5种花卉。
# Find the top 5 most profitable flowers
top5_profit_flowers = df.groupby('flower')['profit'].sum().nlargest(5)
print('Top 5 Most Profitable Flowers:')
print(top5_profit_flowers)
输出如下:
Top 5 Most Profitable Flowers:
flower
Rose         30532.5
Tulip        25037.0
Lily         15823.0
Daisy         9905.0
Sunflower     9517.0
Name: profit, dtype: float64
最后,使用随机森林回归模型来预测未来7天的总收入。
from sklearn.ensemble import RandomForestRegressor
# Forecast the total revenue for the next 7 days using Random Forest Regressor
revenue_ts = df.groupby('date')['price'].sum().reset_index()
revenue_ts['date'] = pd.to_datetime(revenue_ts['date'])
revenue_ts['day'] = revenue_ts['date'].dt.day

X = revenue_ts['day'].values.reshape(-1, 1)
y = revenue_ts['price'].values

model = RandomForestRegressor(n_estimators=100, random_state=42)
model.fit(X, y)

future_dates = pd.date_range(start=revenue_ts['date'].max(), periods=8, freq='D')[1:]
future_days = future_dates.day.values.reshape(-1, 1)

forecast = model.predict(future_days)
print('Forecasted Total Revenue for the Next 7 Days:')
print(pd.Series(forecast, index=future_dates))
输出如下:
Forecasted Total Revenue for the Next 7 Days:
2023-05-01    1836.360355
2023-05-02    1805.565833
2023-05-03    1185.813321
2023-05-04    1282.622365
2023-05-05    1743.691246
2023-05-06    1885.061446
2023-05-07    2132.975299
Freq: D, dtype: float64
这是一个很简单的机器学习模型,其主要步骤是先将日期列转换为时间戳格式,并提取日期中的日信息作为模型的输入特征,将日期特征所对应的总收入作为标签,这也就是模型的输入和输出。然后,创建并训练随机森林回归模型。模型训练好之后,生成未来7天的日期序列,并提取日信息作为模型的输入,最后使用训练好的模型对未来7天的总收入进行预测。
使用 Assistant API 中的 Code Intepreter
上面的几个数据分析示例,虽然不难,但是毕竟还是需要编程基础,一个数据分析师完成上述编程任务,大概需要几个小时到一两天的时间写代码。
那现在呢,我们就通过Assistants API中的Code intepreter工具,以自然语言的方式来完成上述数据分析功能。在这个过程中,Assistants API 的调用流程是固定的,而我们需要设计的只是自然语言提示文本。
先来看一个以文本格式作为输出的数据分析示例。
from dotenv import load_dotenv
load_dotenv()
from openai import OpenAI
import os
import requests
import time
import json

client = OpenAI()

def create_assistant(instructions, file_path):
    with open(file_path, "rb") as file:
        file_obj = client.files.create(file=file, purpose='assistants')
        file_id = file_obj.id

    assistant = client.beta.assistants.create(
        instructions=instructions,
        model="gpt-4",
        tools=[{"type": "code_interpreter"}],
        file_ids=[file_id]
    )
    return assistant

def create_thread(user_message, file_id):
    thread = client.beta.threads.create(
        messages=[
            {
                "role": "user",
                "content": user_message,
                "file_ids": [file_id]
            }
        ]
    )
    return thread

def run_assistant(thread_id, assistant_id):
    run = client.beta.threads.runs.create(
        thread_id=thread_id,
        assistant_id=assistant_id
    )
    return run

def poll_run_status(client, thread_id, run_id, interval=20):
    while True:
        run = client.beta.threads.runs.retrieve(thread_id=thread_id, run_id=run_id)
        print(f"Run的轮询信息:\n{run}\n")
        if run.status in ['requires_action', 'completed']:
            return run
        time.sleep(interval)

def get_assistant_reply(thread_id):
    response = client.beta.threads.messages.list(thread_id=thread_id)
    message = response.data[-1]
    message_content = message.content[0].text
    annotations = message_content.annotations
    citations = []

    for index, annotation in enumerate(annotations):
        message_content.value = message_content.value.replace(annotation.text, f' [{index}]')

        if (file_citation := getattr(annotation, 'file_citation', None)):
            cited_file = client.files.retrieve(file_citation.file_id)
            citations.append(f'[{index}] {file_citation.quote} from {cited_file.filename}')
        elif (file_path := getattr(annotation, 'file_path', None)):
            cited_file = client.files.retrieve(file_path.file_id)
            citations.append(f'[{index}] Click <here> to download {cited_file.filename}')
            download_file(cited_file.filename, file_path.file_id)

    message_content.value += '\n' + '\n'.join(citations)
    return message_content.value

def download_file(filename, file_id):
    file_content = client.files.content(file_id)
    with open(filename, 'wb') as file:
        file.write(file_content)

def main():
    instructions = """
    Please use the flower_sales.csv data to complete the following analysis tasks:
    1. Group the data by region and calculate the total revenue for each region. Visualize the results using a bar chart.
    2. Group the data by date and calculate the daily total revenue. Create a line chart to show the revenue trend over time.
    3. Calculate the sales proportion of each flower type and display the results in a pie chart.
    4. Find the top 5 most profitable flowers based on the total profit.
    5. Using the historical sales data, forecast the total revenue for the next 7 days using a Random Forest Regressor model.
    """

    file_path = r"01_Assitants\CodeIntepreter\flower_sales.csv"

    with open(file_path, "rb") as file:
        file_obj = client.files.create(file=file, purpose='assistants')
        file_id = file_obj.id

    assistant = create_assistant(instructions, file_path)

    user_message = "Please perform the data analysis tasks as instructed."
    thread = create_thread(user_message, file_id)

    run = run_assistant(thread.id, assistant.id)
    print(f"Run status: {run.status}")

    # 轮询Run直到完成或需要操作
    run = poll_run_status(client, thread.id, run.id)

    # 获取Assistant在Thread中的回应
    messages = client.beta.threads.messages.list(thread_id=thread.id)
    print("全部的message", messages)

    # 输出Assistant的最终回应
    print('下面打印最终的Assistant回应:')
    for message in messages.data:
        if message.role == "assistant":
            print(f"{message.content}\n")

if __name__ == "__main__":
    main()
这段代码中,我们先上传数据文件,创建一个Assistant对象和一个Thread对象,然后在Thread上运行Assistant来执行指定的数据分析任务。之后,还是轮询Run的状态,并在Run完成之后,获取并显示Assistant的回复。
其中的关键设计,就是提示信息的设计。
    instructions = """
    Please use the flower_sales.csv data to complete the following analysis tasks:
    1. Group the data by region and calculate the total revenue for each region. Visualize the results using a bar chart.
    2. Group the data by date and calculate the daily total revenue. Create a line chart to show the revenue trend over time.
    3. Calculate the sales proportion of each flower type and display the results in a pie chart.
    4. Find the top 5 most profitable flowers based on the total profit.
    5. Using the historical sales data, forecast the total revenue for the next 7 days using a Random Forest Regressor model.
    """
这里,我们给出的5个数据分析任务,正是和刚才我们用Python数据分析代码来实现的完全一致。
输出如下:
Run的初始信息: queued
Run的轮询信息:
Run(id='run_202iwnMlW8nJVbEKOMPWJqVT', assistant_id='asst_ZzFnvavBoYZ59NDLnLinNC99', cancelled_at=None, completed_at=None, created_at=1713842398, expires_at=1713842998, failed_at=None, incomplete_details=None, instructions='\n Please use the flower_sales.csv data to complete the following analysis tasks:\n # 1. Group the data by region and calculate the total revenue for each region. Visualize the results using a bar chart.\n # 2. Group the data by date and calculate the daily total revenue. Create a line chart to show the revenue trend over time.\n 3. Calculate the sales proportion of each flower type and display the results in a pie chart.\n 4. Find the top 5 most profitable flowers based on the total profit.\n # 5. Using the historical sales data, forecast the total revenue for the next 7 days using a Random Forest Regressor model.\n ', last_error=None, max_completion_tokens=None, max_prompt_tokens=None, metadata={}, model='gpt-4-turbo', object='thread.run', required_action=None, response_format='auto', started_at=1713842398, status='in_progress', thread_id='thread_D3JUkq05bfvtmBw7QoNSuTy7', tool_choice='auto', tools=[CodeInterpreterTool(type='code_interpreter')], truncation_strategy=TruncationStrategy(type='auto', last_messages=None), usage=None, temperature=1.0, top_p=1.0, tool_resources={})
Run的轮询信息:
Run(id='run_202iwnMlW8nJVbEKOMPWJqVT', assistant_id='asst_ZzFnvavBoYZ59NDLnLinNC99', cancelled_at=None, completed_at=1713842464, created_at=1713842398, expires_at=None, failed_at=None, incomplete_details=None, instructions='\n Please use the flower_sales.csv data to complete the following analysis tasks:\n # 1. Group the data by region and calculate the total revenue for each region. Visualize the results using a bar chart.\n # 2. Group the data by date and calculate the daily total revenue. Create a line chart to show the revenue trend over time.\n 3. Calculate the sales proportion of each flower type and display the results in a pie chart.\n 4. Find the top 5 most profitable flowers based on the total profit.\n # 5. Using the historical sales data, forecast the total revenue for the next 7 days using a Random Forest Regressor model.\n ', last_error=None, max_completion_tokens=None, max_prompt_tokens=None, metadata={}, model='gpt-4-turbo', object='thread.run', required_action=None, response_format='auto', started_at=1713842398, status='completed', thread_id='thread_D3JUkq05bfvtmBw7QoNSuTy7', tool_choice='auto', tools=[CodeInterpreterTool(type='code_interpreter')], truncation_strategy=TruncationStrategy(type='auto', last_messages=None), usage=Usage(completion_tokens=1001, prompt_tokens=11781, total_tokens=12782), temperature=1.0, top_p=1.0, tool_resources={})
全部的message SyncCursorPage[Message](data=[Message(id='msg_cRSYdkrscxnyHXimfqqivQZn', assistant_id='asst_ZzFnvavBoYZ59NDLnLinNC99', attachments=[], completed_at=None, content=[TextContentBlock(text=Text(annotations=[], value="The top 5 most profitable flowers based on the total profit are listed below:\n1. **Rose** with a profit of \\$30,532.50\n2. **Tulip** with a profit of \\$25,037.00\n3. **Lily** with a profit of \\$15,823.00\n4. **Daisy** with a profit of \\$9,905.00\n5. **Sunflower** with a profit of \\$9,517.00\n\nThese results reveal which flower types are contributing most significantly to the business's bottom line. \n\nLet's move forward with the final task which involves forecasting the total revenue for the next 7 days using a Random Forest Regressor model. I will prepare the data and develop the model to perform this forecast."), type='text')], created_at=1713842457, incomplete_at=None, incomplete_details=None, metadata={}, object='thread.message', role='assistant', run_id='run_202iwnMlW8nJVbEKOMPWJqVT', status=None, thread_id='thread_D3JUkq05bfvtmBw7QoNSuTy7'), Message(id='msg_QZMADy6BrFb6LTGS0Ho7ruEi', assistant_id='asst_ZzFnvavBoYZ59NDLnLinNC99', attachments=[], completed_at=None, content=[ImageFileContentBlock(image_file=ImageFile(file_id='file-aUTB6yfVsc7AoI0SNfQteuwq'), type='image_file'), TextContentBlock(text=Text(annotations=[], value="The pie chart above presents the proportion of sales for each type of flower, indicating the relative popularity and market share of each flower type within the dataset.\n\nNext, we will proceed with task #4: identifying the top 5 most profitable flowers based on the total profit. I'll sum the profit for each flower type and display the top 5."), type='text')], created_at=1713842450, incomplete_at=None, incomplete_details=None, metadata={}, object='thread.message', role='assistant', run_id='run_202iwnMlW8nJVbEKOMPWJqVT', status=None, thread_id='thread_D3JUkq05bfvtmBw7QoNSuTy7'), Message(id='msg_r0ETiNGjOEaqFuEvw45auB52', assistant_id='asst_ZzFnvavBoYZ59NDLnLinNC99', attachments=[], completed_at=None, content=[ImageFileContentBlock(image_file=ImageFile(file_id='file-ARR9oWz1AdYwLCVeaDNsYfGk'), type='image_file'), TextContentBlock(text=Text(annotations=[], value='The line chart illustrates the daily total revenue from flower sales, showing various trends and fluctuations over time.\n\nMoving on to task #3, I will calculate the sales proportion of each flower type and visualize it using a pie chart.'), type='text')], created_at=1713842442, incomplete_at=None, incomplete_details=None, metadata={}, object='thread.message', role='assistant', run_id='run_202iwnMlW8nJVbEKOMPWJqVT', status=None, thread_id='thread_D3JUkq05bfvtmBw7QoNSuTy7'), Message(id='msg_pfR9okmWbQZTlX5FSpFwKji2', assistant_id='asst_ZzFnvavBoYZ59NDLnLinNC99', attachments=[], completed_at=None, content=[ImageFileContentBlock(image_file=ImageFile(file_id='file-DA3uSxFhVE8KqZFrWKY2YWTX'), type='image_file'), TextContentBlock(text=Text(annotations=[], value="The bar chart above displays the total revenue from flower sales for each region.\n\nNext, let's address task #2 by grouping the data by date and calculating the daily total revenue, which we will then visualize as a line chart to observe trends over time."), type='text')], created_at=1713842433, incomplete_at=None, incomplete_details=None, metadata={}, object='thread.message', role='assistant', run_id='run_202iwnMlW8nJVbEKOMPWJqVT', status=None, thread_id='thread_D3JUkq05bfvtmBw7QoNSuTy7'), Message(id='msg_SCX0Z8qv2VGtFHBGPJkp66E1', assistant_id='asst_ZzFnvavBoYZ59NDLnLinNC99', attachments=[], completed_at=None, content=[TextContentBlock(text=Text(annotations=[], value="The dataset contains the following columns:\n- `date`: The date of sales\n- `flower`: Type of flower sold\n- `count`: The number of flowers sold\n- `price`: Total price received for the flowers sold\n- `cost`: Total cost of the flowers sold\n- `profit`: Total profit from the flower sales\n- `region`: Geographic region of the sales\n\nFrom your requests, we'll proceed with the analysis tasks:\n1. Group the data by region and calculate the total revenue for each region.\n2. Group the data by date and calculate the daily total revenue.\n3. Calculate the sales proportion of each flower type.\n4. Find the top 5 most profitable flowers based on the total profit.\n\nLet's start with task #1 and visualize the total revenue for each region."), type='text')], created_at=1713842408, incomplete_at=None, incomplete_details=None, metadata={}, object='thread.message', role='assistant', run_id='run_202iwnMlW8nJVbEKOMPWJqVT', status=None, thread_id='thread_D3JUkq05bfvtmBw7QoNSuTy7'), Message(id='msg_0wyxD0pWM9DbMOevRVuuwPZW', assistant_id='asst_ZzFnvavBoYZ59NDLnLinNC99', attachments=[], completed_at=None, content=[TextContentBlock(text=Text(annotations=[], value="Let's start by examining the contents of the uploaded CSV file to understand its structure and data types. I will then proceed with the specified data analysis tasks."), type='text')], created_at=1713842399, incomplete_at=None, incomplete_details=None, metadata={}, object='thread.message', role='assistant', run_id='run_202iwnMlW8nJVbEKOMPWJqVT', status=None, thread_id='thread_D3JUkq05bfvtmBw7QoNSuTy7'), Message(id='msg_SujuDWSAVzkKVx45SrhVnQQL', assistant_id=None, attachments=[Attachment(add_to=None, file_id='file-XXkzo0wHANWlrkMd1ZnaESor', tools=[{'type': 'code_interpreter'}])], completed_at=None, content=[TextContentBlock(text=Text(annotations=[], value='Please perform the data analysis tasks as instructed.'), type='text')], created_at=1713842397, incomplete_at=None, incomplete_details=None, metadata={}, object='thread.message', role='user', run_id=None, status=None, thread_id='thread_D3JUkq05bfvtmBw7QoNSuTy7')], object='list', first_id='msg_cRSYdkrscxnyHXimfqqivQZn', last_id='msg_SujuDWSAVzkKVx45SrhVnQQL', has_more=False)
下面打印最终的Assistant回应:
[TextContentBlock(text=Text(annotations=[], value="The top 5 most profitable flowers based on the total profit are listed below:\n1. **Rose** with a profit of \\$30,532.50\n2. **Tulip** with a profit of \\$25,037.00\n3. **Lily** with a profit of \\$15,823.00\n4. **Daisy** with a profit of \\$9,905.00\n5. **Sunflower** with a profit of \\$9,517.00\n\nThese results reveal which flower types are contributing most significantly to the business's bottom line. \n\nLet's move forward with the final task which involves forecasting the total revenue for the next 7 days using a Random Forest Regressor model. I will prepare the data and develop the model to perform this forecast."), type='text')]
[ImageFileContentBlock(image_file=ImageFile(file_id='file-aUTB6yfVsc7AoI0SNfQteuwq'), type='image_file'), TextContentBlock(text=Text(annotations=[], value="The pie chart above presents the proportion of sales for each type of flower, indicating the relative popularity and market share of each flower type within the dataset.\n\nNext, we will proceed with task #4: identifying the top 5 most profitable flowers based on the total profit. I'll sum the profit for each flower type and display the top 5."), type='text')]
[ImageFileContentBlock(image_file=ImageFile(file_id='file-ARR9oWz1AdYwLCVeaDNsYfGk'), type='image_file'), TextContentBlock(text=Text(annotations=[], value='The line chart illustrates the daily total revenue from flower sales, showing various trends and fluctuations over time.\n\nMoving on to task #3, I will calculate the sales proportion of each flower type and visualize it using a pie chart.'), type='text')]
[ImageFileContentBlock(image_file=ImageFile(file_id='file-DA3uSxFhVE8KqZFrWKY2YWTX'), type='image_file'), TextContentBlock(text=Text(annotations=[], value="The bar chart above displays the total revenue from flower sales for each region.\n\nNext, let's address task #2 by grouping the data by date and calculating the daily total revenue, which we will then visualize as a line chart to observe trends over time."), type='text')]
[TextContentBlock(text=Text(annotations=[], value="The dataset contains the following columns:\n- `date`: The date of sales\n- `flower`: Type of flower sold\n- `count`: The number of flowers sold\n- `price`: Total price received for the flowers sold\n- `cost`: Total cost of the flowers sold\n- `profit`: Total profit from the flower sales\n- `region`: Geographic region of the sales\n\nFrom your requests, we'll proceed with the analysis tasks:\n1. Group the data by region and calculate the total revenue for each region.\n2. Group the data by date and calculate the daily total revenue.\n3. Calculate the sales proportion of each flower type.\n4. Find the top 5 most profitable flowers based on the total profit.\n\nLet's start with task #1 and visualize the total revenue for each region."), type='text')]
[TextContentBlock(text=Text(annotations=[], value="Let's start by examining the contents of the uploaded CSV file to understand its structure and data types. I will then proceed with the specified data analysis tasks."), type='text')]
上面日志中的内容过多,我们简单列表总结一下。
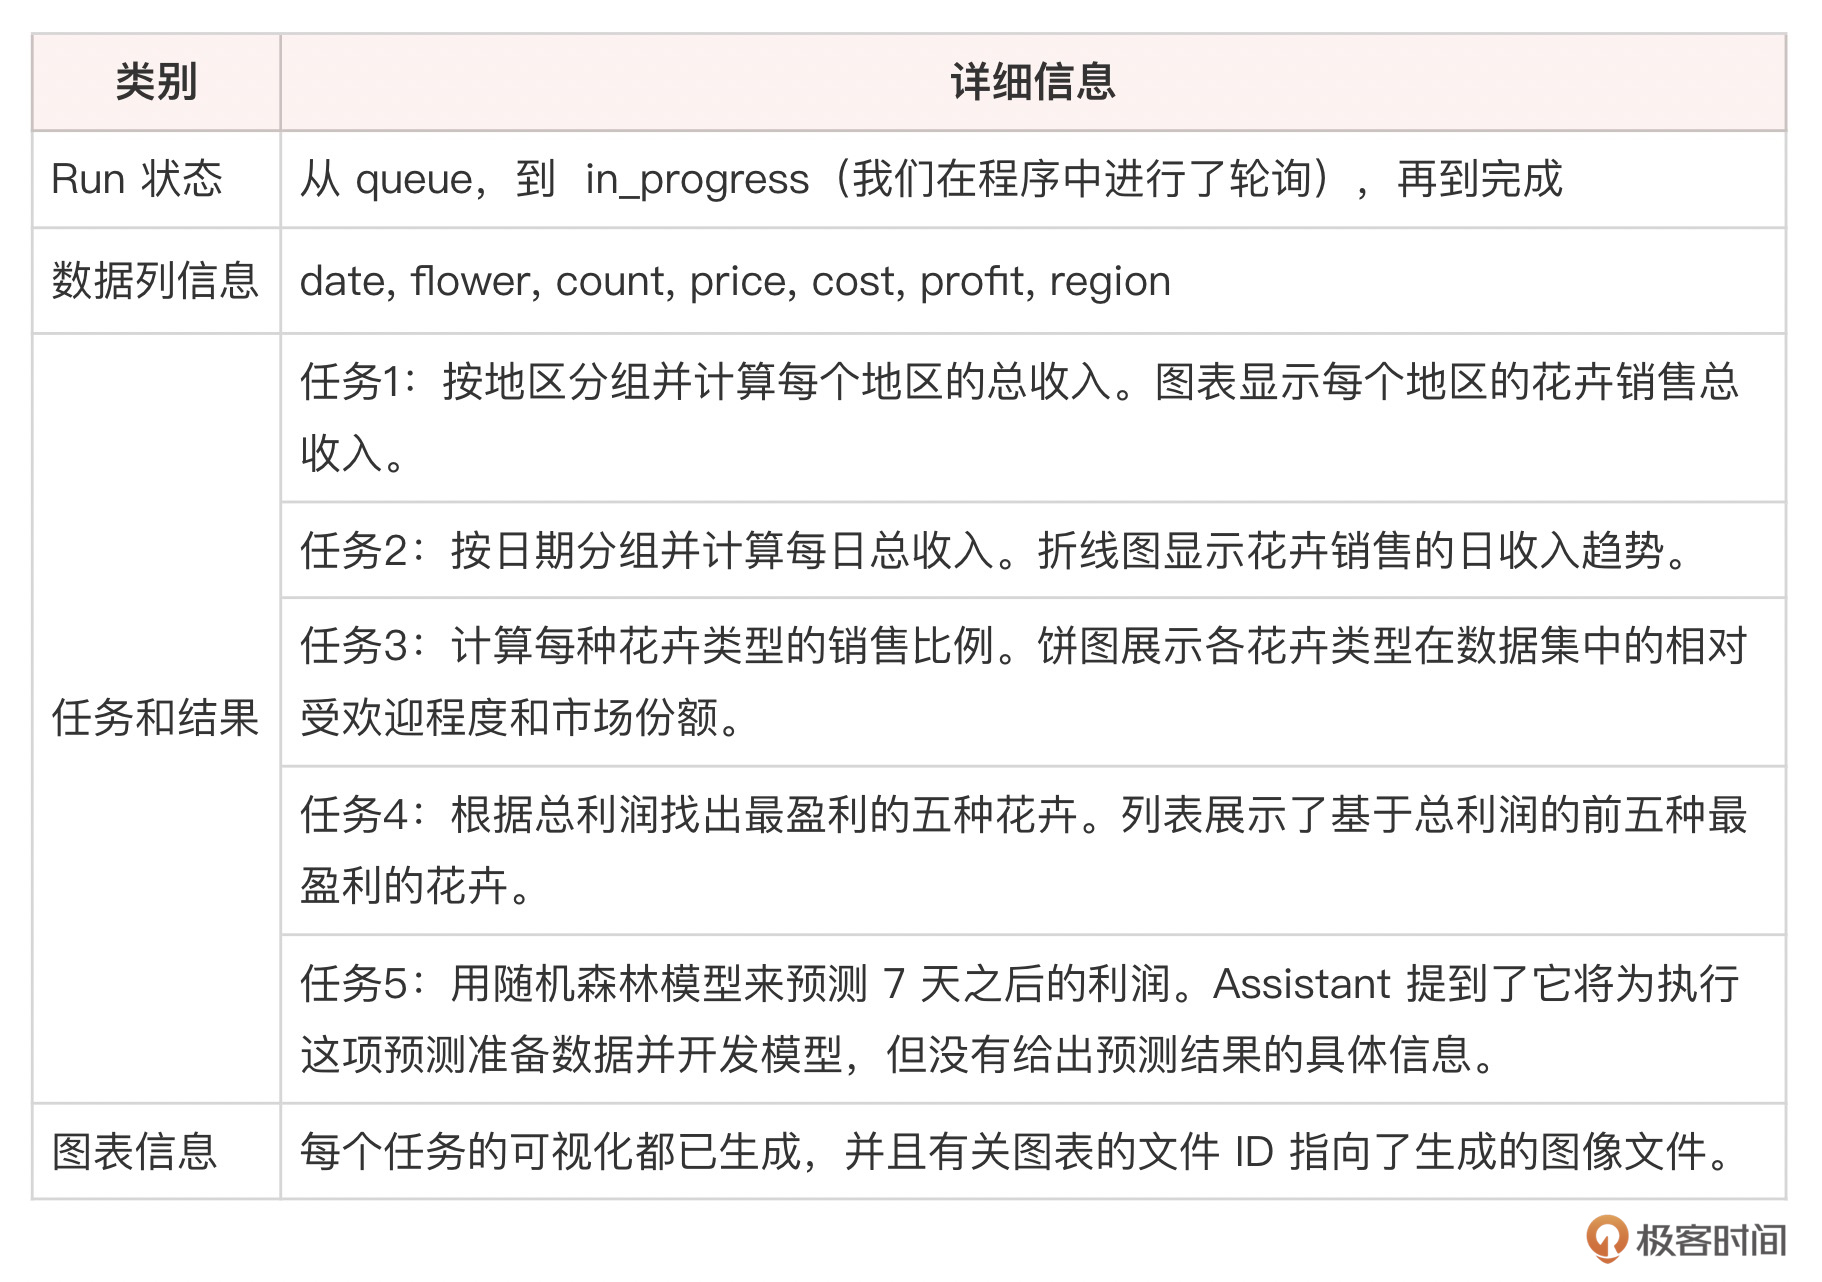
从输出中,可以看到,Assistant声称,饼图已经生成啦,可以下载。下面,我们就把所有的数据分析图片下载下来。
from openai import OpenAI

def download_file(filename, file_id):
    file_content = client.files.content(file_id)
    with open(filename, 'wb') as file:
        file.write(file_content.read())

def get_assistant_messages(thread_id, assistant_id):
    response = client.beta.threads.messages.list(thread_id=thread_id)
    messages = [message for message in response.data if message.role == 'assistant' and message.assistant_id == assistant_id]
    return messages

def process_message(message):
    for content_block in message.content:
        if content_block.type == 'image_file':
            file_id = content_block.image_file.file_id
            filename = f"image_{file_id}.png"
            download_file(filename, file_id)
            print(f"Downloaded image: {filename}")
        elif content_block.type == 'text':
            text = content_block.text.value
            annotations = content_block.text.annotations
            for annotation in annotations:
                if annotation.type == 'file_path':
                    file_id = annotation.file_path.file_id
                    filename = annotation.text.split('/')[-1]
                    download_file(filename, file_id)
                    print(f"Downloaded file: {filename}")

def main():
    thread_id = 'thread_D3JUkq05bfvtmBw7QoNSuTy7'
    assistant_id = 'asst_ZzFnvavBoYZ59NDLnLinNC99'

    messages = get_assistant_messages(thread_id, assistant_id)
    for message in messages:
        process_message(message)

if __name__ == "__main__":
    client = OpenAI()
    main()
运行程序,代码分析器(也就是数据分析助手)创建的图片将出现在你的本地目录中。
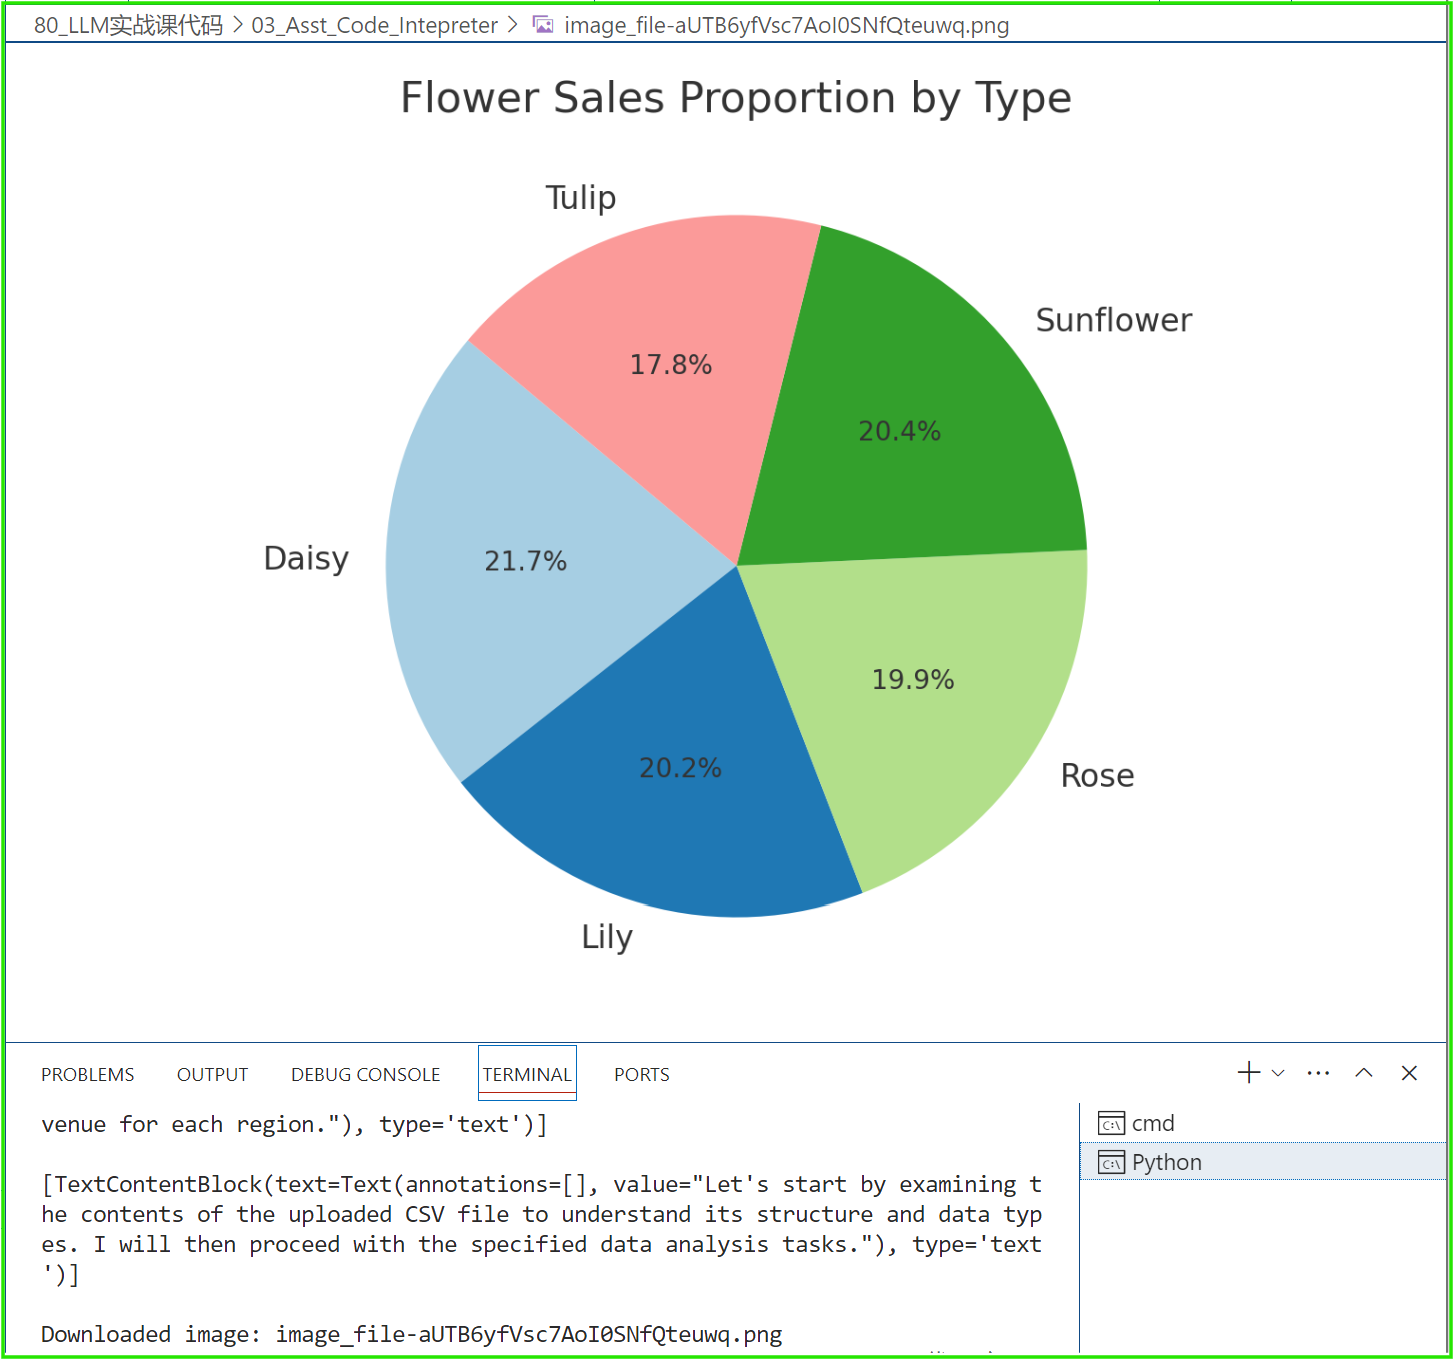
好啦,经过上面的展示,你可以看到,我们使用Assistants中的Code interpreter做数据分析时,所需要的切换是从“数据分析编程”到调用Assistants API 进行“自然语言编程”。
当你非常熟悉了Assistants API的使用流程后,当然是用“自然语言编程”更节省心力啦!
总结时刻
本课中,我们深入浅出地介绍了如何使用OpenAI的Code interpreter工具进行数据分析。通过对比手写Python代码和使用自然语言调用Code interpreter,你应该可以清晰地理解这两种方式的异同。
我最想向你强调的,也就是整个大语言模型应用开发的基本思路,本质上,就是从计算机语言编码,到自然语言编码的范式转换。这一转变的意义在于降低了数据分析的门槛。使用自然语言描述分析需求,无需掌握复杂的编程技能,更多的人可以参与到数据分析的过程中来。同时提高了分析效率。通过自然语言交互,分析人员可以快速迭代分析思路,不必花费大量时间编写和调试代码。Code interpreter会自动生成优化后的代码,并给出结果。
与此同时,这种编程范式促进了人机协作。分析人员提出需求,机器自动执行分析并生成可视化图表,双方优势互补。人的创造力和洞察力,与机器的计算能力和执行力相结合,可以实现更加智能高效的数据分析。这也预示了未来人机交互的趋势。随着自然语言处理技术的发展,我们与计算机交流的方式会变得越来越自然,越来越接近人与人之间的交流。编程语言或许会成为历史,自然语言则会成为人机交互的主要方式。
思考题
- 本示例中的提示信息我是用英文写的,请你用中文提示试试效果。
- 在本示例的任务5:用随机森林模型来预测7天之后的利润中,Assistant犯懒了,没有真正实现,为什么?请你加强提示语,或者把它作为一个单独的任务重新设计实现。
- 未来,自然语言驱动的数据分析模式可能在哪些场景下大显身手? 又有哪些场景目前还难以适用?
- 自然语言驱动的趋势是否意味着编程技能将变得不再重要?数据分析人员如何在这一趋势下提升自己的职业竞争力?传统的编程技能与自然语言交互能力如何实现互补?
其实,有的题目并没有标准答案,我们可以在留言区一起探讨,那么,我期待看到你的留言。如果今天的内容让你有所收获,也欢迎你把这节课转发给有需要的朋友!我们下节课再见!
- qinsi 👍(2) 💬(1)
主要还是怕幻觉吧。生成代码五分钟,检查代码五小时,总体上可能还没人写得快。code interpreter是确保代码至少能跑得起来。
2024-05-24 - 陈东 👍(1) 💬(1)
以上这些案例分析来自于实际工作吗?老师能否适当增加实际工作要用到的例子?,谢谢。
2024-05-24 - Geek_6e7726 👍(0) 💬(1)
老师提出的这些问题,后面有专门一章统一回复么?
2024-06-07 - 排骨 👍(0) 💬(1)
自然语言处理(NLP)和生成式预训练模型(如GPT-4)的发展确实使得与计算机的交互变得更加直观和自然。然而,这并不意味着编程技能将变得不再重要。相反,编程技能和自然语言交互能力可以互补,共同提升数据分析人员的职业竞争力。
2024-06-03 - Simon WZ 👍(0) 💬(0)
这样子看,其实这Function calling和Code Interpreter的功能在GPT中都也有,那使用Assistants跟直接调用GPT最明显区别是什么?
2024-06-25 - Alex 👍(0) 💬(0)
def create_assistant(instructions, file_path): with open(file_path, "rb") as file: file_obj = client.files.create(file=file, purpose='assistants') file_id = file_obj.id assistant = client.beta.assistants.create( instructions=instructions, model="gpt-4", tools=[{"type": "code_interpreter"}], file_ids=[file_id] ) return assistant 老师这里的file_ids好像应该去掉吧? 查看文档 https://platform.openai.com/docs/api-reference/assistants/createAssistant 这里如果是tool 为 file_search的场景的话 用tool_resources读取文件向量 请老师指教下 是不是我理解错了?
2024-06-10