加餐04 SQL实战:证券场景的数据查询与优化
你好,我是陈博士。今天我们来探讨一下客户持仓配置建议业务的SQL分析。
合理的资产配置,是确保客户投资组合既能满足其财务目标,又能有效管理风险的关键。通过深入的数据查询和分析,我们可以评估客户的当前资产状况、风险承受能力以及投资偏好,从而提供个性化的资产配置建议。
针对该场景,我整理了2张数据表以及对应的查询问题。针对这些查询问题,你可以了解到这些SQL该如何撰写。
数据表
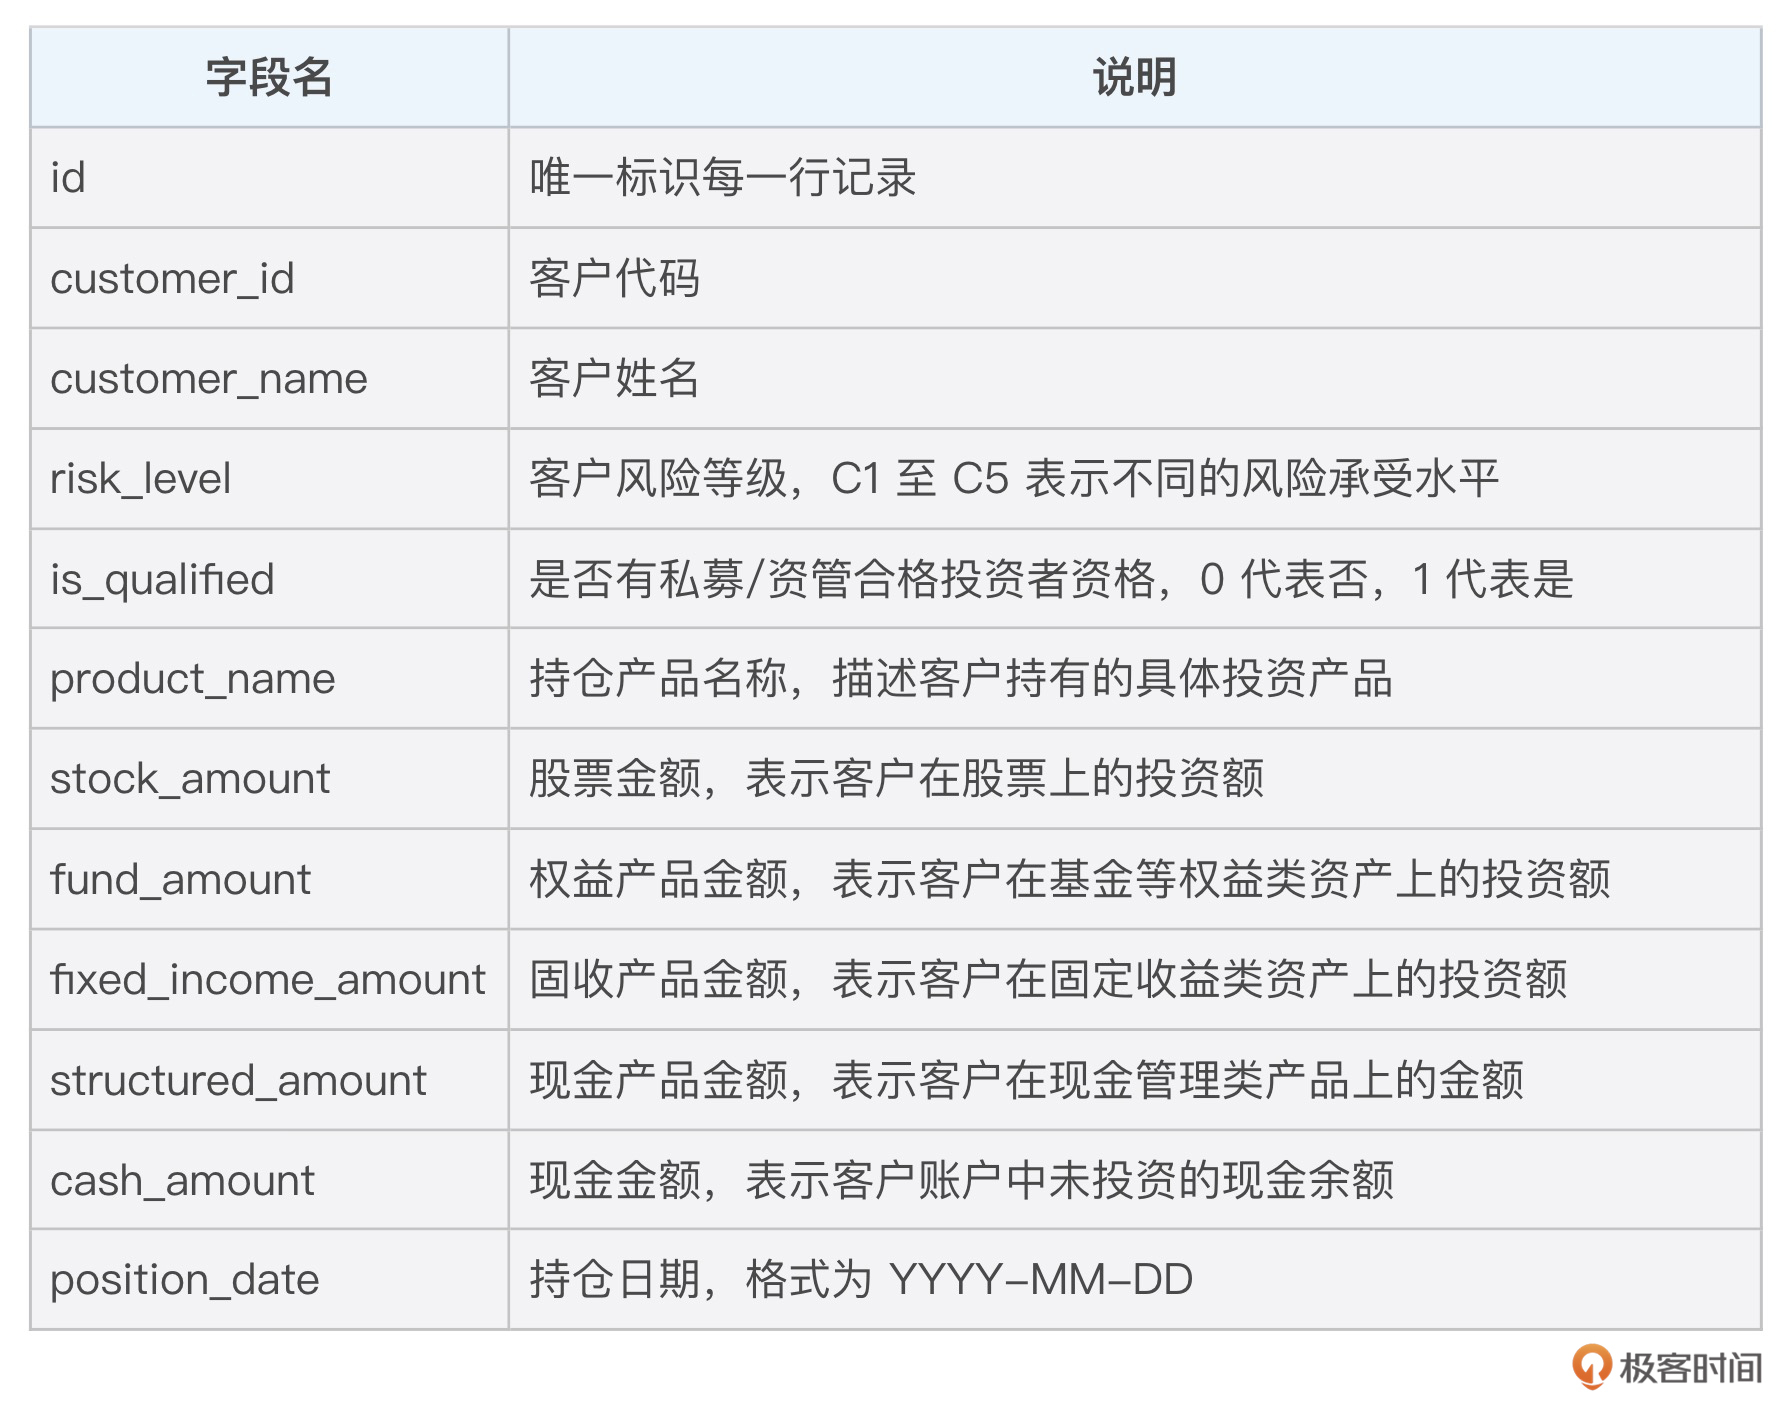
- 客户持仓表 customer_positions
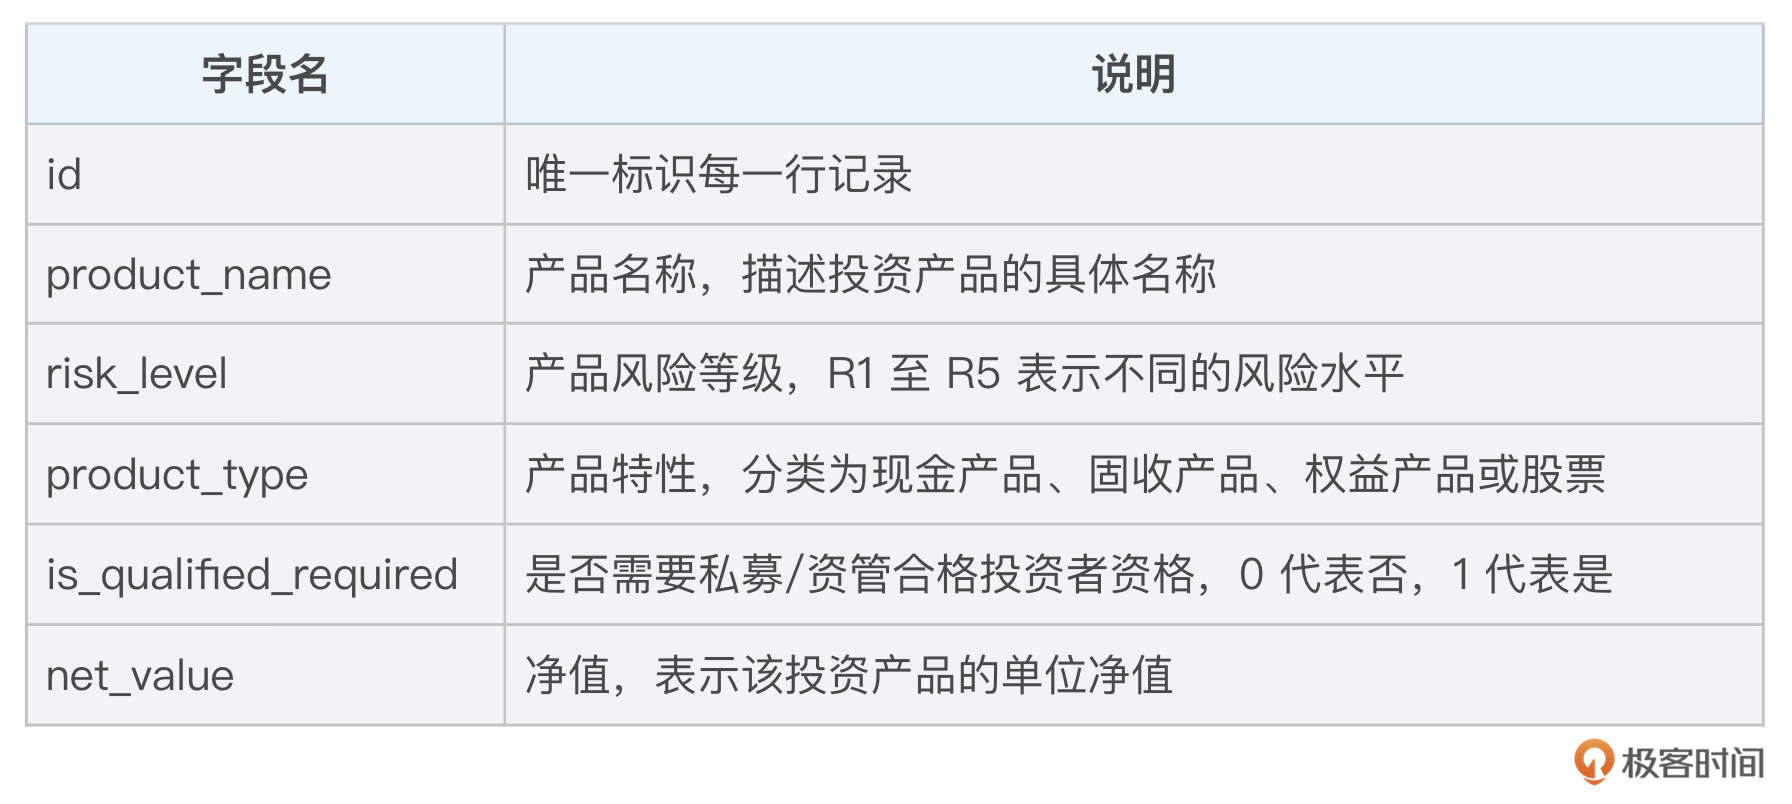
- 产品配置表 product_configuration
问题设定
我从客户资产分析、资产配置分析、风险等级分析、产品持仓排名等维度设置了一些常见的查询问题,一起来看一下。
1. 客户资产分析
查询指定客户(customer_id = ‘C00001’)在特定日期(2024-12-21)的各类资产(股票、基金、固收、结构性产品、现金)具体金额是多少?总资产是多少?
SELECT
    customer_id,
    customer_name,
    SUM(stock_amount) as total_stock,
    SUM(fund_amount) as total_fund,
    SUM(fixed_income_amount) as total_fixed_income,
    SUM(structured_amount) as total_structured,
    SUM(cash_amount) as total_cash,
    SUM(stock_amount + fund_amount + fixed_income_amount + structured_amount + cash_amount) as total_assets
FROM customer_positions FORCE INDEX (idx_customer_id)
WHERE customer_id = 'C00001'
AND position_date = '2024-12-21'
GROUP BY customer_id, customer_name;

// 说明: 使用 SUM() 聚合函数计算各类资产总金额,并通过 GROUP BY 按客户分组。FORCE INDEX 提示优化查询性能,确保快速定位指定客户和日期的数据。
2. 资产配置分析
在特定日期(2024-12-21),每个客户的股票资产占比、基金资产占、固定收益类占比、结构性产品占比、现金占比是多少?
WITH customer_total AS (
    SELECT
        customer_id,
        SUM(stock_amount + fund_amount + fixed_income_amount + structured_amount + cash_amount) as total_assets
    FROM customer_positions
    WHERE position_date = '2024-12-21'
    GROUP BY customer_id
)
SELECT
    cp.customer_id,
    cp.customer_name,
    ROUND(SUM(stock_amount) / ct.total_assets * 100, 2) as stock_ratio,
    ROUND(SUM(fund_amount) / ct.total_assets * 100, 2) as fund_ratio,
    ROUND(SUM(fixed_income_amount) / ct.total_assets * 100, 2) as fixed_income_ratio,
    ROUND(SUM(structured_amount) / ct.total_assets * 100, 2) as structured_ratio,
    ROUND(SUM(cash_amount) / ct.total_assets * 100, 2) as cash_ratio
FROM customer_positions cp
JOIN customer_total ct ON cp.customer_id = ct.customer_id
WHERE cp.position_date = '2024-12-21'
GROUP BY cp.customer_id, cp.customer_name, ct.total_assets;

// 说明:使用CTE预计算每位客户总资产,再通过JOIN结合明细数据计算各类资产占比。ROUND() 函数确保百分比结果的可读性。
3. 风险等级分析
在特定日期(2024-12-21),按风险等级统计,每个风险等级有多少个客户?每个风险等级的客户平均持有多少股票、基金、固收、结构性产品和现金?
SELECT STRAIGHT_JOIN
    risk_level,
    COUNT(DISTINCT customer_id) as customer_count,
    ROUND(AVG(stock_amount), 2) as avg_stock,
    ROUND(AVG(fund_amount), 2) as avg_fund,
    ROUND(AVG(fixed_income_amount), 2) as avg_fixed_income,
    ROUND(AVG(structured_amount), 2) as avg_structured,
    ROUND(AVG(cash_amount), 2) as avg_cash
FROM customer_positions FORCE INDEX (idx_position_date)
WHERE position_date = '2024-12-21'
GROUP BY risk_level
ORDER BY risk_level;

// 说明:使用 COUNT(DISTINCT) 统计各风险等级客户数量,AVG() 计算各类资产的平均持有量。STRAIGHT_JOIN 提示优化查询路径,确保高效执行。
4. 产品持仓排名
在特定日期(2024-12-21),哪10个产品持有人数最多?这些产品的总持仓金额是多少?
SELECT
    product_name,
    COUNT(DISTINCT customer_id) as holder_count,
    SUM(stock_amount + fund_amount + fixed_income_amount + structured_amount + cash_amount) as total_amount
FROM customer_positions
WHERE position_date = '2024-12-21'
AND product_name != '现金'
GROUP BY product_name
ORDER BY holder_count DESC, total_amount DESC
LIMIT 10;

// 说明:通过 COUNT(DISTINCT) 统计每个产品的持有人数,使用 SUM() 计算总持仓金额。ORDER BY 和 LIMIT 用于筛选出前10个最受欢迎的产品。
5. 客户资产变动分析
每个客户的每日总资产是多少?相比前一日的资产变动额是多少?相比前一日的资产变动百分比是多少?
WITH daily_assets AS (
    SELECT
        customer_id,
        position_date,
        SUM(stock_amount + fund_amount + fixed_income_amount + structured_amount + cash_amount) as total_assets
    FROM customer_positions
    GROUP BY customer_id, position_date
)
SELECT
    a.customer_id,
    a.position_date,
    a.total_assets,
    a.total_assets - LAG(a.total_assets) OVER (PARTITION BY a.customer_id ORDER BY a.position_date) as daily_change,
    ROUND((a.total_assets - LAG(a.total_assets) OVER (PARTITION BY a.customer_id ORDER BY a.position_date)) /
          LAG(a.total_assets) OVER (PARTITION BY a.customer_id ORDER BY a.position_date) * 100, 2) as change_percentage
FROM daily_assets a
ORDER BY a.customer_id, a.position_date;

// 说明:使用CTE计算每日总资产,LAG() 函数获取前一日资产值,进而计算日变动额和变动百分比。PARTITION BY 和 ORDER BY 确保按客户和日期正确排序。

OVER (PARTITION BY ...) 是 SQL 中窗口函数的一部分,用于定义窗口或分区,即数据集的一个子集。它允许我们在不改变行数的情况下对数据进行分组计算,而窗口函数则在这个定义的窗口上执行累积、移动平均等操作。
6. 产品类型分布
在特定日期(2024-12-21),查询不同类型产品的总持仓金额和客户数。
SELECT
    IFNULL(pc.product_type, 'Unknown') as product_type,
    COUNT(DISTINCT cp.customer_id) as customer_count,
    SUM(CASE
        WHEN pc.product_type = 'STOCK' THEN cp.stock_amount
        WHEN pc.product_type = 'EQUITY' THEN cp.fund_amount
        WHEN pc.product_type = 'FIXED_INCOME' THEN cp.fixed_income_amount
        WHEN pc.product_type = 'STRUCTURED' THEN cp.structured_amount
        ELSE cp.cash_amount
    END) as total_amount
FROM customer_positions cp
LEFT JOIN product_configuration pc ON cp.product_name = pc.product_name
WHERE cp.position_date = '2024-12-21'
GROUP BY pc.product_type WITH ROLLUP;  -- 添加汇总行

// 说明:使用 LEFT JOIN 关联产品配置表,通过 CASE 语句按产品类型汇总总持仓金额,COUNT(DISTINCT) 统计客户数,GROUP BY ... WITH ROLLUP 提供分类汇总和总计行。

GROUP BY ... WITH ROLLUP 是 SQL 中用于生成分组汇总报表的扩展语法。它在标准 GROUP BY 分组的基础上,为每个分组字段添加了额外的汇总行(即小计和总计),从而提供了更丰富的分析视角。
如果你是证券行业的从业人员,这节课将对你非常有帮助。期待你的转发,我们下节课再见!